 ar
ar bg
bg hr
hr cs
cs da
da nl
nl fi
fi fr
fr de
de el
el hi
hi it
it ko
ko no
no pl
pl pt
pt ro
ro ru
ru es
es sv
sv tl
tl iw
iw id
id lv
lv lt
lt sr
sr sk
sk sl
sl uk
uk vi
vi et
et hu
hu th
th tr
tr fa
fa ms
ms hy
hy ka
ka ur
ur bn
bn mn
mn ta
ta kk
kk uz
uz ku
ku
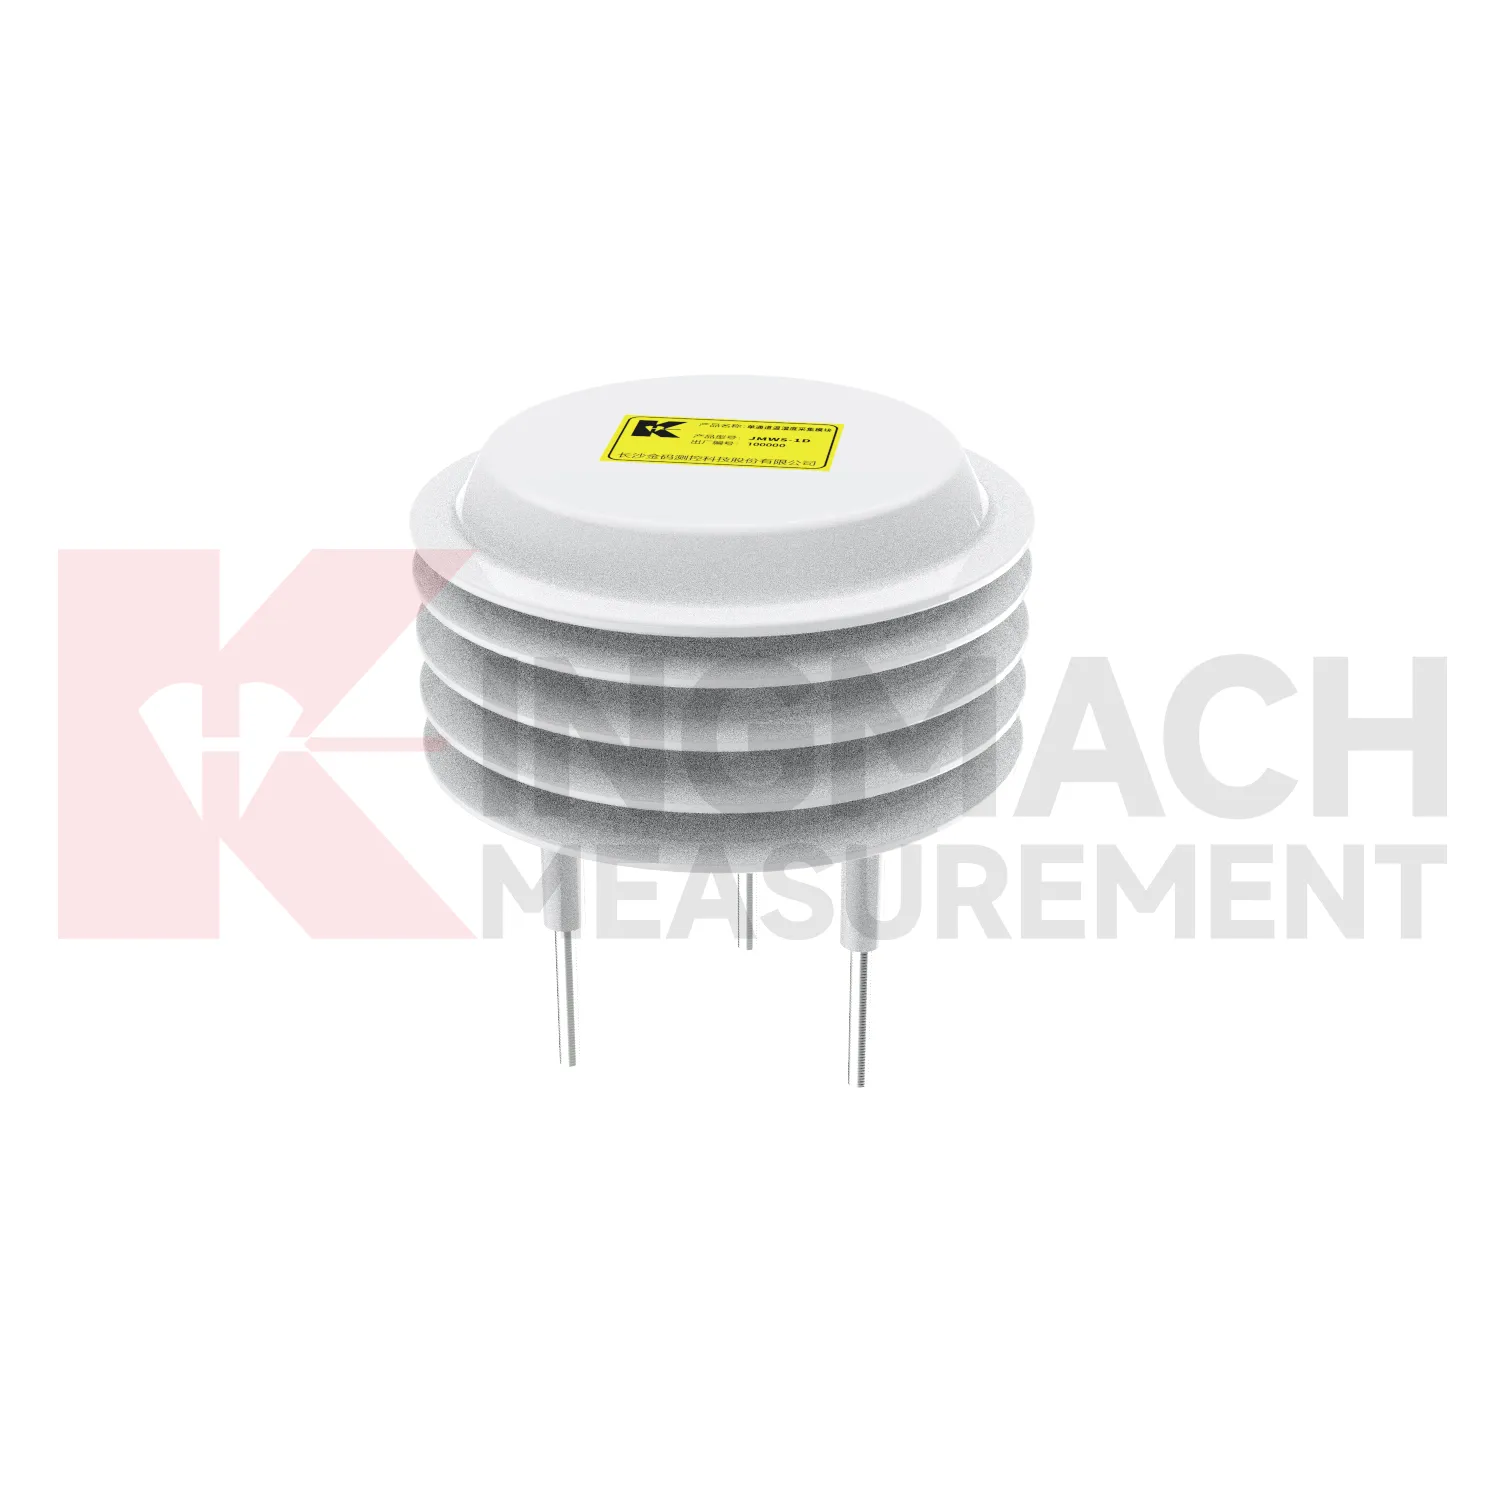
Daisy-Chained Digital Thermometer
Air temperature and humidity monitoring in Kingmach Daisy-Chained Digital Thermometer is useful wherever the environment affects people, equipment, cabinets, sensors, or structural interpretation. Underground stations, tunnels, shopping areas, factories, mines, construction zones, and equipment rooms can change quickly after ventilation adjustments, water entry, heating, cooling, or heavy site activity. A temperature and humidity point should be placed where it represents the condition being reviewed, not simply where installation is easy. If the target is a cabinet, the point belongs near the cabinet environment. If the target is an occupied or underground space, the placement should reflect airflow and working conditions. These records help explain condensation, corrosion, electrical faults, concrete curing context, and changes in other sensor readings. They are also useful for maintenance scheduling because repeated high humidity or heat exposure can shorten the life of connectors, enclosures, and acquisition equipment.
For owners, the strongest record is the one that remains understandable after staff changes. Clear units, plain point names, installation photos, maintenance notes, and linked structural channels make the data usable beyond the original project team.
For field teams, this point is most useful when the record shows the condition before the structural response, during the response, and after the site returns to routine operation. The note should include weather timing, inspection access, nearby construction, and whether the linked structural points changed in the same period.

Application of Daisy-Chained Digital Thermometer
Tunnel and subway projects use Kingmach Daisy-Chained Digital Thermometer to follow underground air conditions, water-related changes, and equipment environments. Temperature and humidity can affect cabinet reliability, corrosion risk, sensor stability, and worker comfort. Rainfall outside a portal may relate to seepage or slope movement near entrances. Airflow or pressure differences can matter in shafts, stations, equipment rooms, and construction zones. Environmental readings should be reviewed with settlement, convergence, displacement, crack records, water-level observations, and maintenance notes. Point naming is especially important underground because many sections look similar after construction. A useful record includes chainage, side, elevation, equipment area, and sensor purpose. When a fault, leak, or deformation appears, environmental data helps the team understand whether the change followed weather, ventilation, construction, or equipment operation.
Underground maintenance teams also need environmental records that point to access reality. A damp equipment room, a warm cabinet zone, a portal affected by rain, and a ventilated platform area may all belong to the same project but require different responses. The report should keep these areas separate.
For handover, tunnel records should preserve section drawings, cabinet names, drainage notes, ventilation changes, and photographs after installation. This helps future teams know whether a humidity or temperature change came from site operation, water entry, seasonal weather, or equipment relocation.
The future of Daisy-Chained Digital Thermometer
Compatibility will remain a future requirement for Kingmach Daisy-Chained Digital Thermometer. Environmental stations often combine different signal paths, power needs, units, enclosures, cables, and data logger settings. If these details are not planned, installation becomes slow and later replacement becomes confusing. Future specifications should define data output, unit conversion, channel capacity, sampling plan, power source, protection needs, maintenance access, and platform display before installation begins. Clear compatibility keeps environmental data usable through commissioning, operation, repair, and handover. It also prevents a monitoring station from becoming dependent on undocumented field improvisation.
Future compatibility work should also cover spare parts and replacement paths. If a station must be repaired after years of service, the owner should know which signal type, unit conversion, connector style, enclosure space, and platform channel are required before field crews arrive.
This planning reduces downtime during storms, construction stages, and maintenance windows. It also helps teams replace one component without changing the meaning of the environmental record or breaking the link to structural channels.
Care & Maintenance of Daisy-Chained Digital Thermometer
Soil-condition maintenance for Kingmach Daisy-Chained Digital Thermometer should protect the contact between the buried point and the surrounding material. Air gaps, disturbed soil, cable damage, excavation, animal activity, or water paths along the cable can all affect readings. Installation records should include depth, soil type, location photo, cable route, and first stable value. During review, compare soil wetness with rainfall, irrigation, groundwater, and nearby deformation. If a buried channel becomes flat or jumps suddenly, inspect cable continuity and recent site work before treating it as a real soil change. Buried points are easy to forget, so their maintenance history must be visible in the project file.
If the reading seems unusual, the team should check the physical condition of the station before drawing conclusions about the asset. Blockage, poor exposure, loose wiring, water entry, and changed surroundings can all create misleading patterns.
A practical report links the condition value with time, place, and action. It should help a reviewer decide whether to keep observing, inspect the field point, compare nearby instruments, or record the event as normal site behavior.
Kingmach Daisy-Chained Digital Thermometer
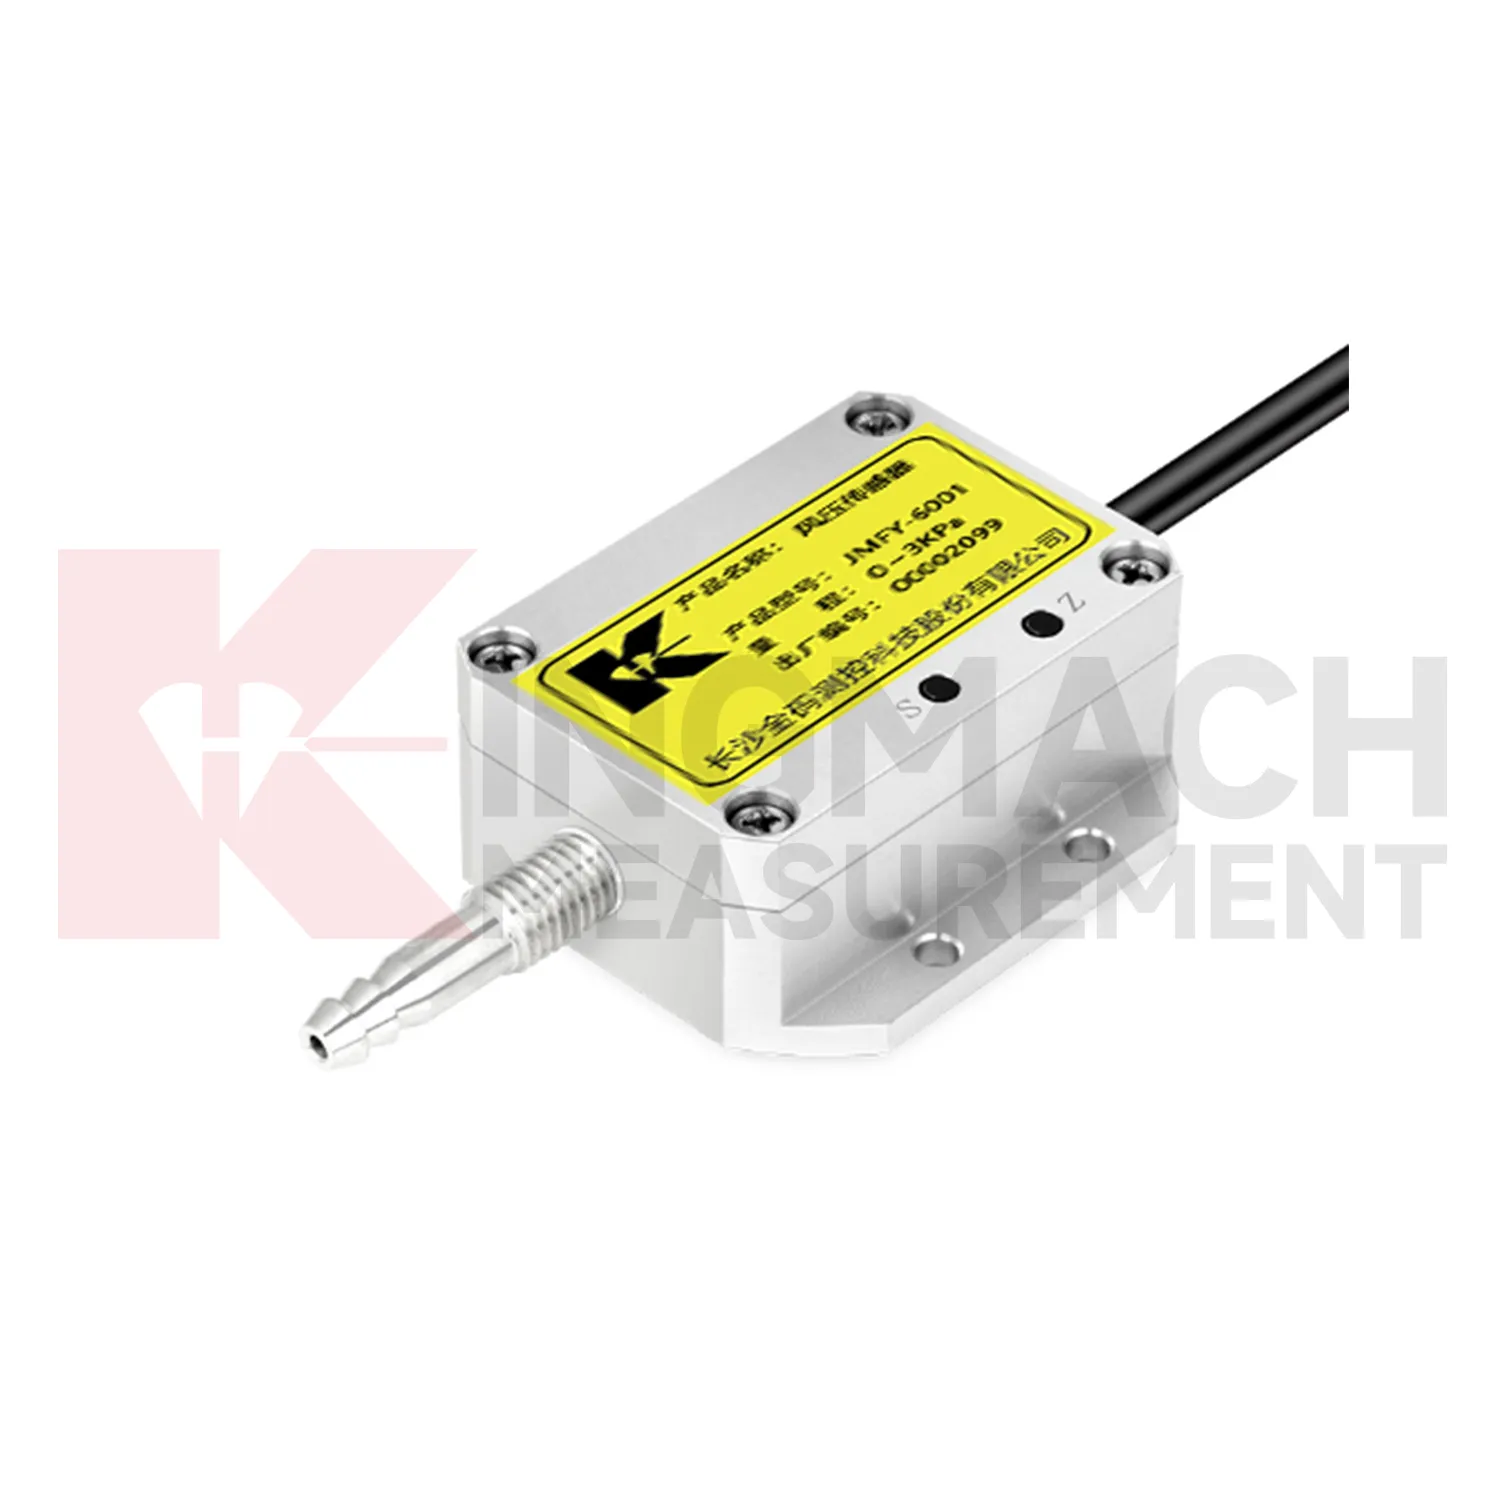
Wind exposure makes Kingmach Daisy-Chained Digital Thermometer relevant to bridges, towers, airports, marine areas, tunnels, and high outdoor structures. Wind speed, direction, and pressure can affect vibration, access safety, temporary works, lifting operations, and inspection planning. A bridge response during strong crosswind should not be read the same way as a response during calm weather. A tower vibration record means more when the wind direction and timing are known. Wind data should be placed where it represents the monitored asset, with attention to height, obstruction, mounting stability, and cable protection. A clean wind record gives engineers a way to separate normal weather-driven response from behavior that needs a closer structural review.
For field teams, this point is most useful when the record shows the condition before the structural response, during the response, and after the site returns to routine operation. The note should include weather timing, inspection access, nearby construction, and whether the linked structural points changed in the same period.
FAQ
Q: What maintenance does Kingmach Daisy-Chained Digital Thermometer need?
A: Maintenance includes cleaning, leveling, exposure checks, cable inspection, enclosure checks, unit verification, and data-quality review.
Q: What should be checked after storms?
A: Check rain catchment, cabinet water entry, cable damage, wind mounting, soil-point disturbance, and the first stable data after inspection.
Q: What causes misleading records?
A: Poor placement, blocked catchment, sheltered wind exposure, weak soil contact, water in cabinets, channel swaps, or missing maintenance notes can mislead reviewers.
Q: How often should inspections happen?
A: Frequency depends on exposure, asset risk, access, weather season, and how strongly the environmental data affects engineering decisions.
Q: How should replacement be handled?
A: Record the old and new condition, date, reason, point photo, channel change, and first stable value after replacement.
The environmental point should be part of a named monitoring question. It may explain wetting, drying, wind exposure, thermal movement, cabinet stress, or pressure variation, but that purpose needs to be visible in drawings and reports.
Reviews
Joshua Clark
We ordered a full monitoring solution including sensors and data loggers. Everything works seamlessly together. Great supplier!
David Wilson
We purchased displacement transducers and settlement sensors, and the quality exceeded our expectations. Easy installation and reliable performance.
Latest Inquiries
To protect the privacy of our buyers, only public service email domains like Gmail, Yahoo, and MSN will be displayed. Additionally, only a limited portion of the inquiry content will be shown.
Mia***@gmail.comNetherlands
Dear team, we are interested in your readouts & data loggers compatible with multiple sensors. Do yo...
Charlotte***@gmail.comUnited Arab Emirates
Hi, we require instrumentation cables suitable for harsh environments. Could you advise on specifica...
Related product categories
- wind pressure sensor
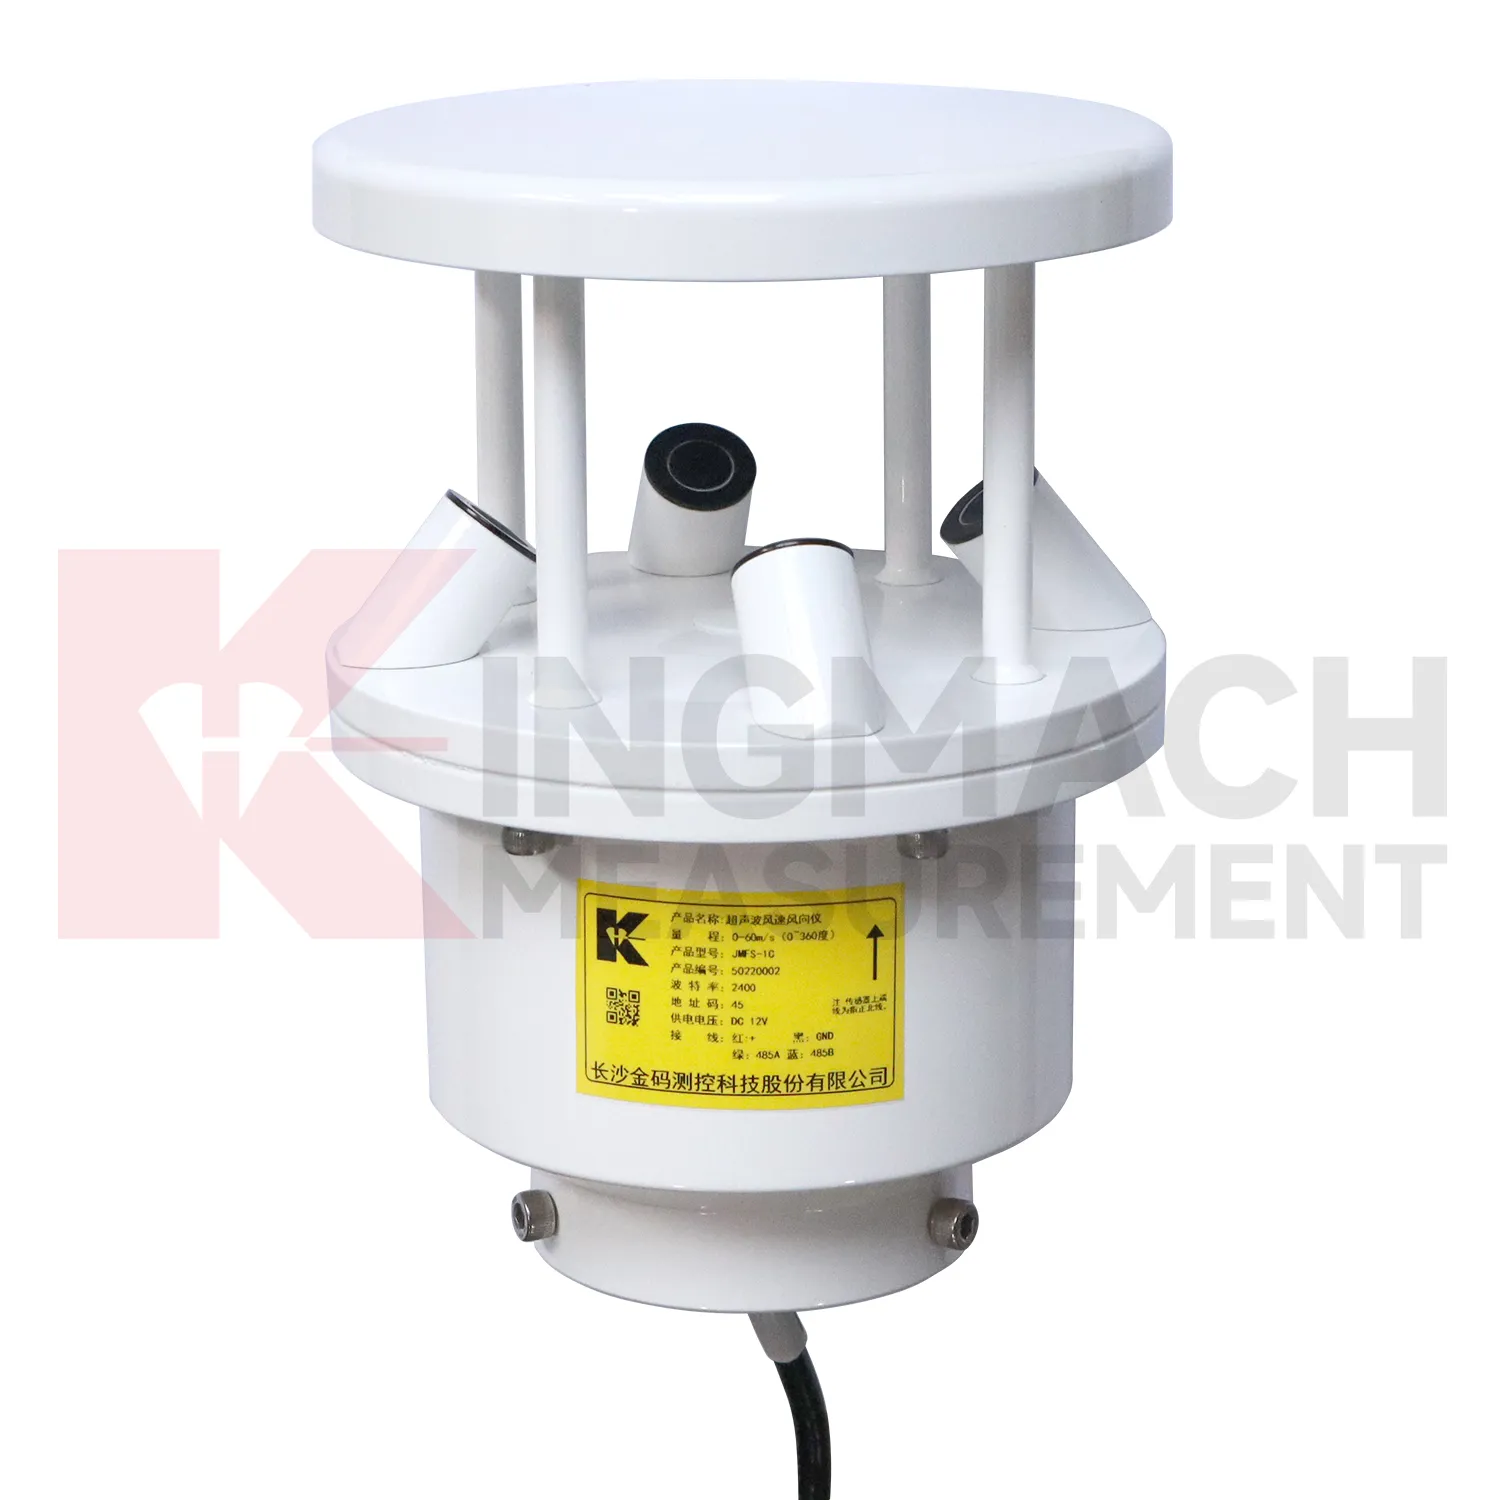
- ultrasonic wind speed and direction sensor
- wind speed and direction sensor
- wind speed and wind direction sensor
- wind speed and direct sensor
- wireless wind speed and direction sensor
- wind direction and speed sensor
- wind speed and direction sensors
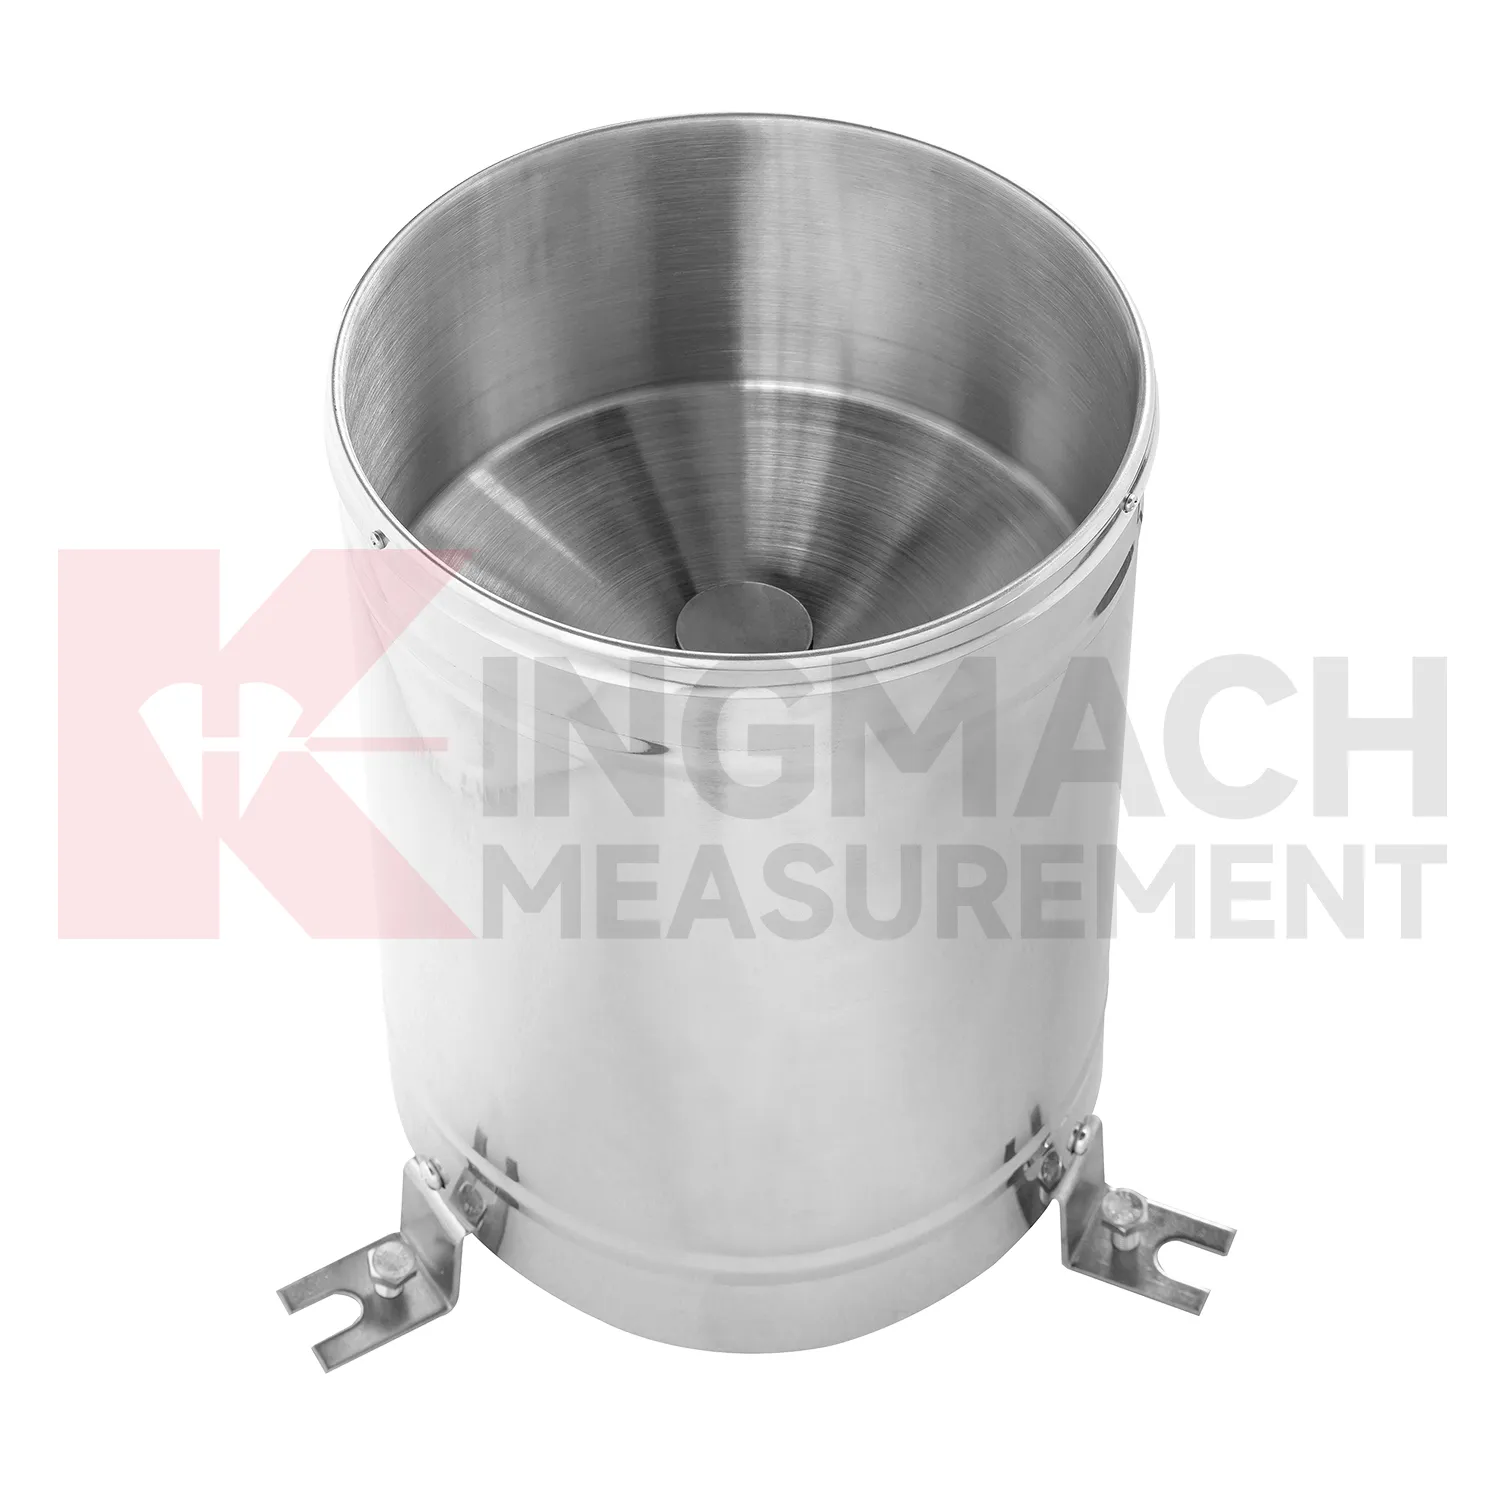
- tipping bucket rain gauge
- tipping bucket rain gauge resolution 0.2 mm standard
- tipping bucket rain gauges
- tipping bucket rain gauge resolution 0.1 mm 0.2 mm standard