 ar
ar bg
bg hr
hr cs
cs da
da nl
nl fi
fi fr
fr de
de el
el hi
hi it
it ko
ko no
no pl
pl pt
pt ro
ro ru
ru es
es sv
sv tl
tl iw
iw id
id lv
lv lt
lt sr
sr sk
sk sl
sl uk
uk vi
vi et
et hu
hu th
th tr
tr fa
fa ms
ms hy
hy ka
ka ur
ur bn
bn mn
mn ta
ta kk
kk uz
uz ku
ku
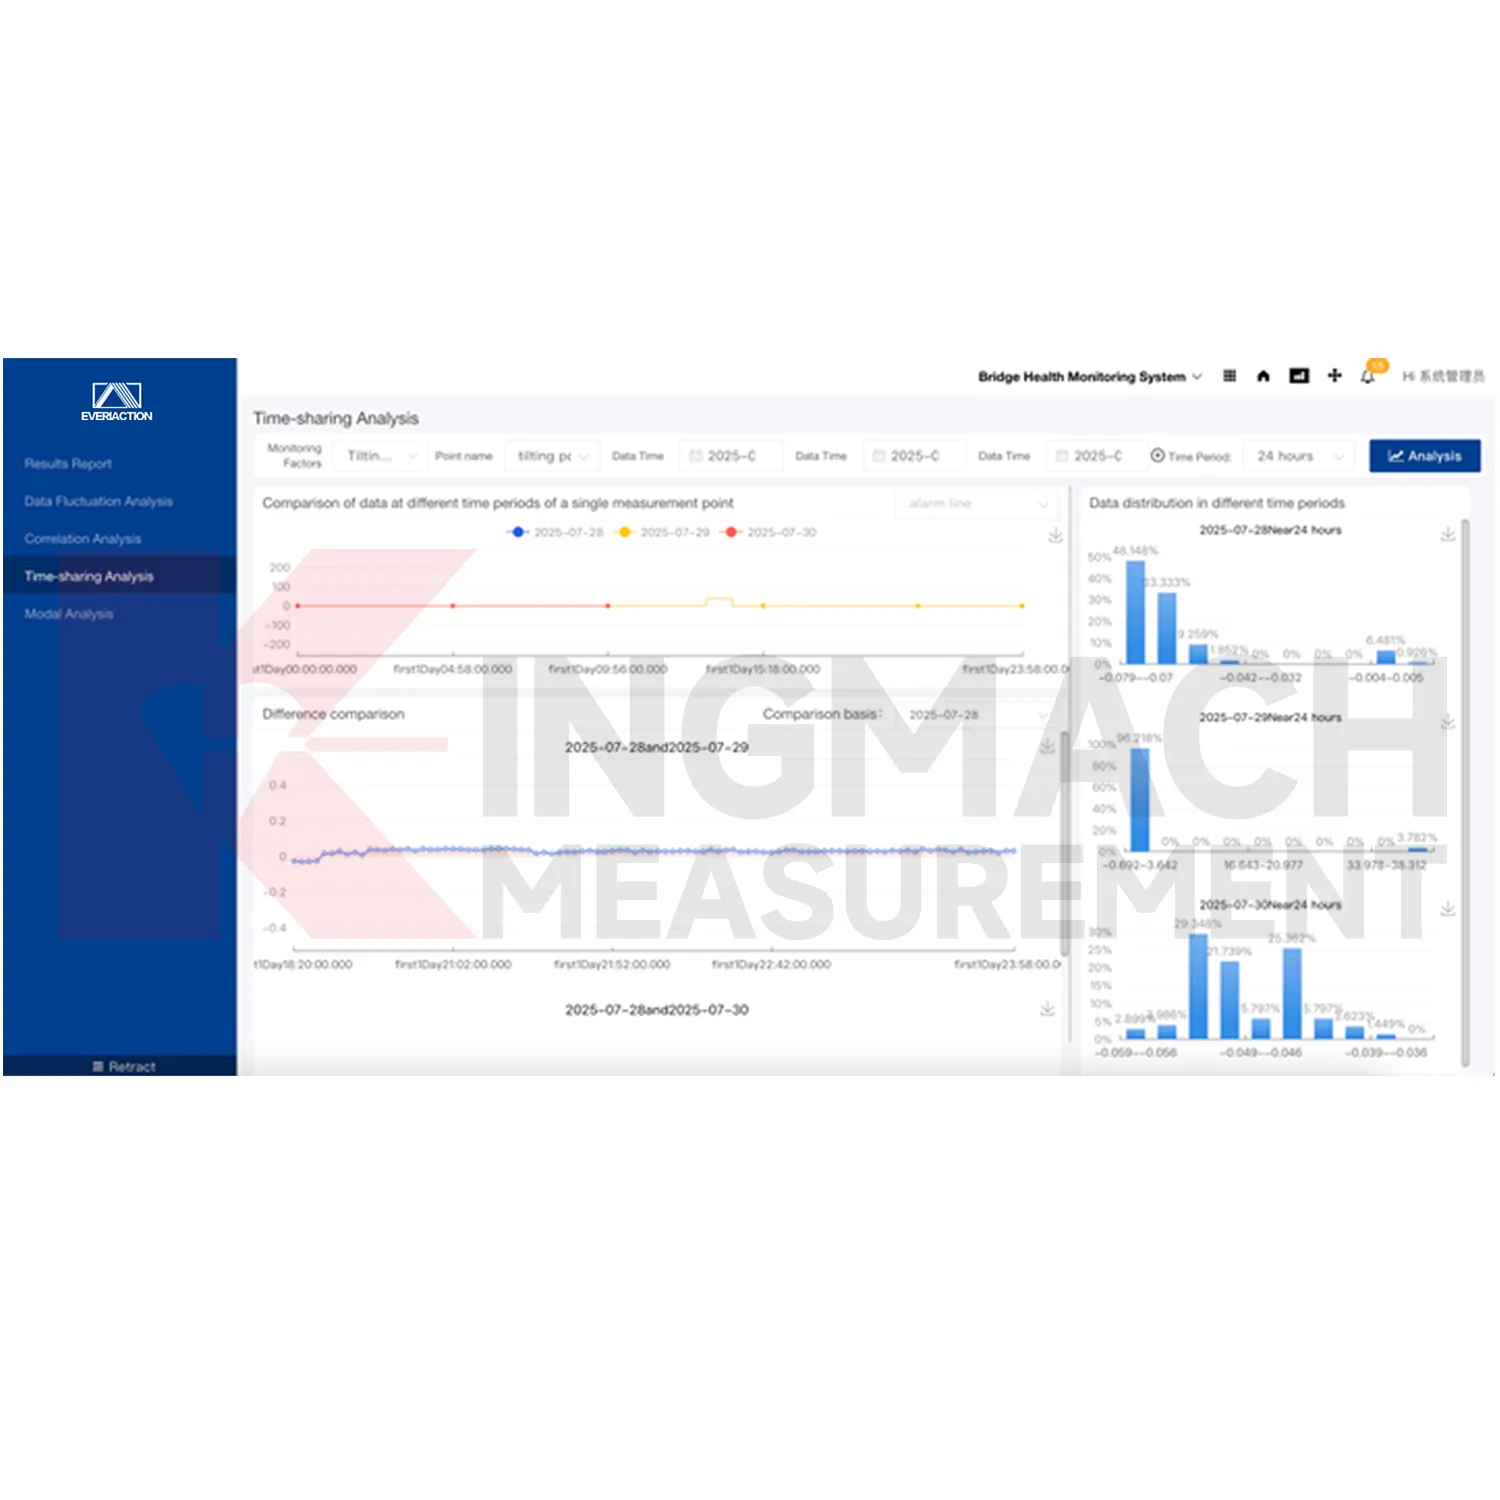
Visualization Software
The platform supports graphical display so complex monitoring data can be converted into clearer visual information. Users can review trends, abnormal early warnings, and reports through a more intuitive interface. This is important because a raw table of readings is rarely enough for quick engineering management. Graphs, alarm status, project documents, and maintenance notes help users see what has changed and what needs attention. Kingmach Visualization Software is therefore positioned as a digital management layer above the field instruments.
Application of Visualization Software
Tunnel monitoring uses Kingmach Visualization Software to manage deformation, convergence, settlement, water level, vibration, temperature, and construction activity records. Tunnel data can change during excavation, lining work, nearby blasting, drainage changes, or operation. A project-based platform helps compare readings across sections and dates, then connect abnormal values with inspection and maintenance notes. Real-time filtering and alarm configuration help teams respond before a localized issue is hidden inside large volumes of routine data.
The future of Visualization Software
Future use of Kingmach Visualization Software will grow as civil engineering monitoring moves from isolated instrument readings to connected asset management. More structures will rely on sensors, acquisition modules, wireless devices, and cloud platforms to maintain a continuous safety record. The software layer will become the place where owners review not just one reading, but the relationship between trends, alarms, inspections, weather, construction, and maintenance work. A platform that integrates multiple data sources will be central to that shift.
Care & Maintenance of Visualization Software
Data quality checks should be routine in Kingmach Visualization Software. Look for missing values, frozen channels, impossible jumps, timestamp errors, unit mismatch, repeated noise, or disagreement between related sensors. A platform can display data quickly, but engineering trust depends on the quality of the incoming records. When a problem appears, check the field device, cable, communication path, acquisition module, and recent configuration changes before treating the reading as structural behavior.
Kingmach Visualization Software
Kingmach Visualization Software supports remote monitoring by letting data move from devices to the Cloud Platform through wired or wireless transmission. This is important for assets that are hard to access, such as slopes, dams, tunnels, bridges, wind towers, and distributed infrastructure. Remote data does not remove the need for site inspection, but it helps teams decide when inspection is needed and where to focus. Real-time storage and filtering also help preserve event records when weather, construction, traffic, or equipment operation changes the monitoring pattern.
FAQ
Q: What certification is listed?
A: The product information lists GB50982-2014 certification.
Q: What is the minimum order quantity?
A: The local product page lists one piece as the minimum order quantity.
Q: What is the delivery time?
A: Delivery time is listed as instant for the software platform.
Q: How is pricing handled?
A: Pricing is listed as negotiable, so project scope, configuration, and integration needs should be confirmed with Kingmach.
Q: What payment term is shown?
A: The local product page lists T/T in advance.
Reviews
Matthew Garcia
Instrumentation cables are durable and perform well even in harsh environments. Will definitely order again.
Joshua Clark
We ordered a full monitoring solution including sensors and data loggers. Everything works seamlessly together. Great supplier!
Latest Inquiries
To protect the privacy of our buyers, only public service email domains like Gmail, Yahoo, and MSN will be displayed. Additionally, only a limited portion of the inquiry content will be shown.
Emma***@gmail.comCanada
Dear Sir/Madam, we are interested in displacement transducers and settlement sensors for a geotechni...
Ava***@gmail.comAustralia
Hi, I am looking for reliable tiltmeters and accelerometers for structural health monitoring. Please...
Related product categories
- Monitoring Software Suite
- Monitoring system software platform
- Environmental Monitoring
- Visualization Software
- GPS Displacement Monitoring System
- Integrated Monitoring Station
- Settlement Monitoring Rod
- Structural Health Monitoring (SHM) System
- Structural Monitoring Cloud Platform
- IoT Online Monitoring System
- Monitoring System Platform & Services
- Engineering Pulse Intelligent Monitoring Cloud Platform